-
Serway and Jewett, Physics for scientist and Engineers with modern physics, Brook/Coole publishers, Eighth edition
-
Paul Tipler and Gene Mosca, Physics for scientist and engineers with modern physics, Sixth edition, W.H.Freeman and Company
-
James Walker, Physics, Addison-Wesley publishers, 4th Edition
-
Douglas C Giancoli, Physics for scientist & Engineers with modern physics, Pearson Prentice Hall, 4th edition.
-
H.C.Verma, Concepts of physics volume 1 and Volume 2, Bharati Bhawan Publishers
-
Tarasov and Tarasova, Question and problems in school physics, Mir Publishers

ICT CORNER
Heat and Thermodynamics
STEPS:
• Use the URL or scan the QR code to open interactive simulation on ‘Pressure and Volume Diagram ”. • At selected temperature, change the “Volume” given below the graph and click play button. • Now select a different temperature, change the ‘Volume’ again and find the change in the pressure both in the left image and graph. • Repeat the same with different values and try drawing the graph accordingly. This also helps to understand isothermal process.
At selected temperature, change the “Volume” given below the graph and click play button.
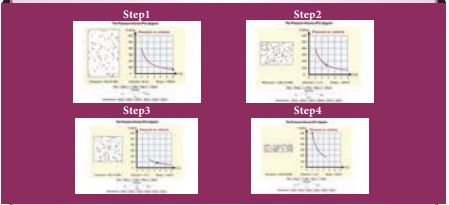
URL:
http://physics.bu.edu/~duffy/HTML5/PV_diagram.html
- Pictures are indicative only.
- If browser requires, allow Flash Player or Java Script to load the page.